
Your website feels slow. You have read a list of twenty things to fix, most of them written for developers, and you have no idea which one is actually costing you visitors.
Here is the short answer. To improve website speed, measure it first with Google PageSpeed Insights, then work through five fixes in this order: your images, your third-party scripts, your caching and CDN, your hosting, and your layout stability. On most small business websites, the first two account for the majority of the problem.
That order matters more than the list itself. Nearly every guide on this topic gives you fourteen or eighteen tips of equal weight, which is how people end up spending a Saturday minifying CSS on a site whose real problem is a 4MB hero image.
This guide covers the five that matter, how to tell which one applies to you, and one piece of very common advice you can now safely ignore.
Key Takeaways
- Measure before you change anything. Google PageSpeed Insights is free and tells you exactly which fix applies to your site. Guessing wastes hours.
- Images are almost always the biggest single win on a small business website, and the easiest to fix without a developer.
- Third-party scripts are the most under-diagnosed cause. Chat widgets, tracking pixels and booking embeds are frequently slower than everything you built put together.
- "Reduce your number of HTTP requests" is outdated advice. It comes from a version of the web that has been superseded. Most articles on this topic, including our own previous version of this one, still repeat it.
- Three numbers define "fast" in Google's eyes: LCP under 2.5 seconds, INP under 200 milliseconds, CLS under 0.1.
Why website speed is worth your time
Speed matters for two separate reasons, and it helps to keep them apart.
The first is commercial. A visitor who waits is a visitor who leaves, and the ones who leave are disproportionately the ones on a phone with a patchy signal, which for most local businesses is a large share of their traffic. Nobody abandons a page because it loaded in 1.8 seconds instead of 1.4. Plenty abandon one that takes six.
The second is search. Google uses page experience signals as part of how it ranks pages. Speed on its own will not lift a weak page above a strong one, and anyone who tells you otherwise is selling something. But when two pages are otherwise comparable, it contributes. If your site is not appearing in search at all, speed is not your problem and you should start here instead.
The honest position: speed is a hygiene factor. Being fast will not win you customers by itself. Being slow will quietly cost you some.
First, measure it properly
Do not skip this. Every fix below applies to some websites and not others, and the only way to know which is which is to look.
Go to Google PageSpeed Insights, paste in your URL, and run it. It is free, it needs no account, and it gives you two things: a score out of 100, and a list of specific opportunities ranked by how much time each would save.
Ignore the score. Genuinely. It is a lab simulation, it swings between runs, and it flattens five separate measurements into one number that tells you nothing about which to fix. What you want is the Metrics block underneath it, and the Insights list below that, where the report ranks your actual problems by how much each one would save.
Here is our own homepage, run on a throttled mobile connection.
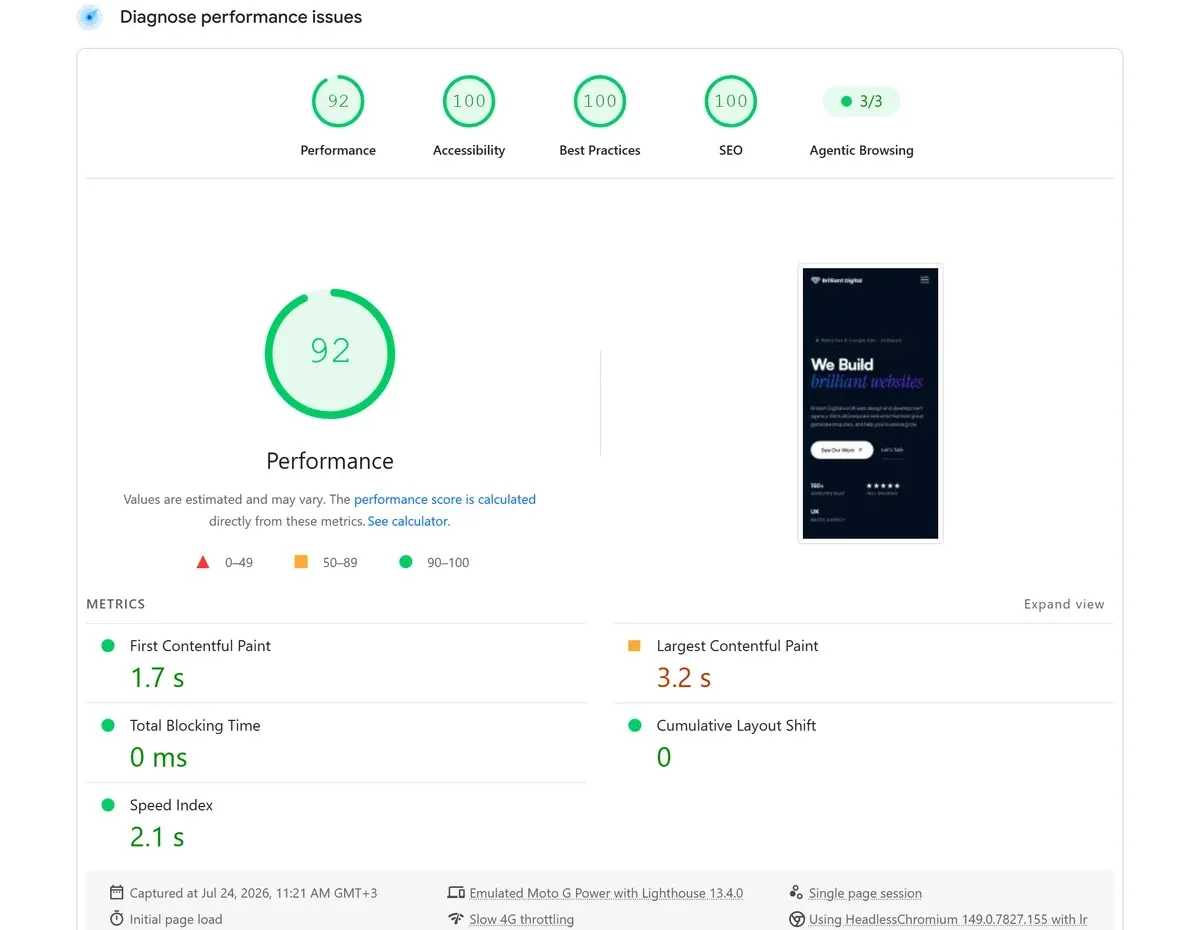
It scores 92, which sounds fine. But Largest Contentful Paint is 3.2 seconds and flagged amber, because the threshold for good is 2.5. The largest saving in its insights list is image delivery, at 146KB. That is a site built by a web agency that pays attention to this, and the score still hid the one number that actually matters. Yours will do the same.
One thing worth knowing before you run it. At the top of the report is a panel of real-world data from actual Chrome users, and on most small business websites it will say No Data, because the site does not get enough traffic for Google to collect a sample. Ours says exactly that. It is not a fault, and it does not mean you are invisible to Google. It just means the lab test below is what you have to work with.
The three numbers that actually define "fast"
Google measures page experience through three metrics, collectively called Core Web Vitals. These are the published thresholds for a good result, and they are what your report is grading you against.
- Largest Contentful Paint (LCP) measures how long until the main content appears. Under 2.5 seconds is good, 2.5 to 4.0 seconds needs work, and over 4.0 seconds is poor.
- Interaction to Next Paint (INP) measures how quickly the page responds when someone taps or clicks. Under 200 milliseconds is good, 200 to 500 needs work, and over 500 is poor.
- Cumulative Layout Shift (CLS) measures how much the page jumps about while loading. Under 0.1 is good, 0.1 to 0.25 needs work, and over 0.25 is poor.
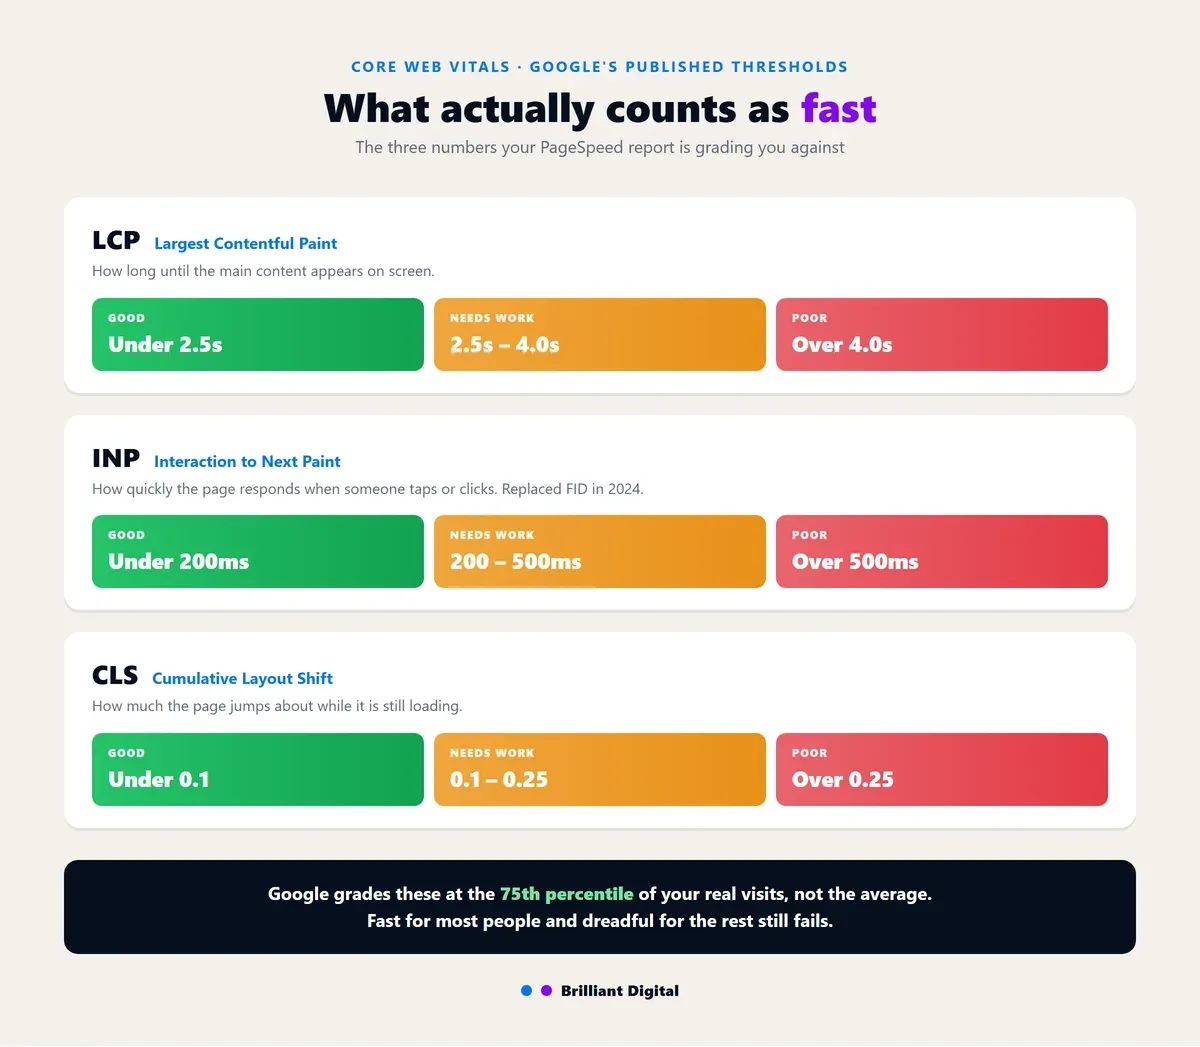
Two notes worth having. Google grades these at the 75th percentile of your visits, not the average, so a site that is fast for most people and dreadful for the rest will still fail. And INP replaced an older metric called First Input Delay as a Core Web Vital in 2024, so if you are reading a guide that still refers to FID, it predates that change and may be out of date in other ways too.
If you want a second opinion, GTmetrix and Pingdom both run similar tests with a different presentation. They are useful for cross-checking, but PageSpeed Insights is the one aligned with what Google actually measures, so start there.
Now, the fixes, in the order we would work through them on a client site.
1. Fix your images
The single biggest win on most small business websites, and the one you can do yourself.
Images are typically the heaviest thing on a page by a wide margin. The usual culprit is a photograph uploaded straight off a phone or a stock library at 4000 pixels wide, displayed in a slot 600 pixels wide. The browser downloads all four thousand pixels and throws most of them away.
Here is the same photograph, prepared both ways.
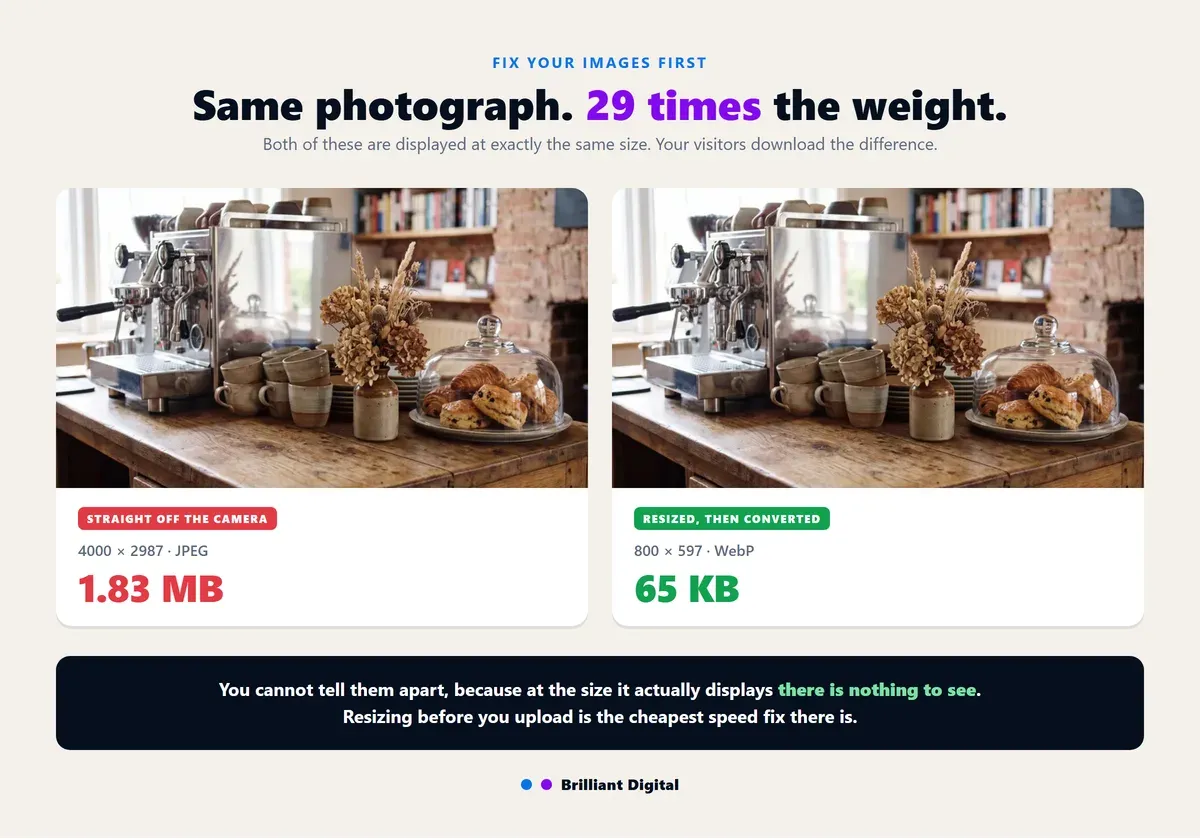
One is 1.83 MB. The other is 65 KB. They are indistinguishable at the size the page actually shows them, because the extra pixels were never visible in the first place. That is 29 times the download for nothing at all. Put six of those on a page and it is carrying more than 10 MB of waste.
There are four things to do, in this order.
Resize before you upload. If an image displays at 800 pixels wide, it does not need to be 3000. This one change routinely removes more weight than everything else on this page combined.
Use a modern format. WebP and AVIF produce substantially smaller files than JPEG or PNG at the same visible quality, and every current browser supports them. Most content management systems will convert on upload, either natively or with a plugin.
Compress what is left. Tools like TinyPNG or ShortPixel will strip out data you cannot see. On a well-shot photograph you can usually lose a large fraction of the file size before anyone notices a difference.
Lazy load the ones below the fold. Adding loading="lazy" tells the browser not to download an image until the visitor scrolls near it. There is one important exception: never lazy load your main hero image. That is almost certainly your LCP element, and delaying it makes the metric Google cares about worse, not better.
If you only do one thing from this entire article, resize your images.
2. Cut the third-party scripts
The most commonly missed cause, and often the largest one on an otherwise well-built site.
This is the fix that surprises people. You can build a lean, well-coded website and still have it crawl, because of code you did not write and may have forgotten you added.
Every chat widget, tracking pixel, cookie banner, review carousel, booking embed, heatmap tool, and marketing tag is a request to somebody else's server. You do not control how fast that server responds, how big their file is, or what it does once it arrives. A single chat widget can weigh more than an entire well-built homepage.
They also tend to accumulate invisibly. A tag gets added for a campaign that ended two years ago and nobody removes it, because nobody remembers it is there.
This is what the list looks like, again on our own site. It is worth knowing the shape of it, because this is the screen you are looking for.
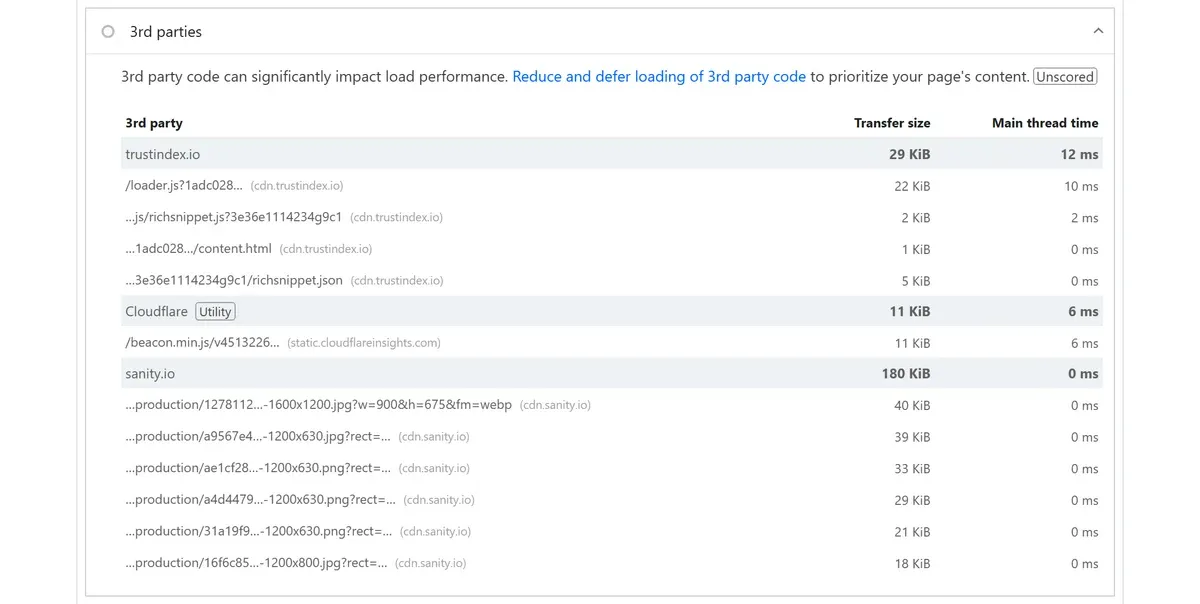
Ours is deliberately short: a reviews widget, Cloudflare's analytics, and our image CDN. That is what a controlled footprint looks like. The sites with a problem have ten entries, and the top one costs more main thread time than everything the agency actually built.
What to do:
- Expand the "3rd parties" insight in your PageSpeed Insights report. It lists every external service with its transfer size and how long it occupied the browser's main thread. This is your inventory, and most people have never opened it.
- Delete anything you are not actively using. Old analytics tools, retired A/B testing scripts, social widgets nobody clicks. If you cannot name what it does and who looks at its data, it goes.
- Audit your tag manager. If you use Google Tag Manager, the container is one script but it can be loading a dozen more. Go through the tags individually.
- Question the ones that survive. A live chat widget that produces two enquiries a month may not be worth what it costs every other visitor. That is a business decision, not a technical one, but it should be made deliberately rather than by default.
3. Turn on caching and put a CDN in front
Cheap, largely one-off, and it helps every visitor after the first.
These are two things that do a similar job: get the page to the visitor without rebuilding or moving it further than necessary.
Caching means storing a ready-made copy rather than assembling the page from scratch on every visit. Browser caching stores files on the visitor's own device so a returning visitor downloads far less. Server-side caching stores the finished page so your server is not rebuilding it for every request. On WordPress this is a plugin, and the usual recommendations are WP Rocket or the free W3 Total Cache. On a modern static setup it is largely handled for you.
A CDN (content delivery network) keeps copies of your files on servers around the world and serves each visitor from the nearest one. For a business serving one UK town this matters less than it does for an international site, but it is still worth having, because good CDNs bring other things with them: automatic compression, image optimisation, and support for newer, faster connection protocols.
Cloudflare's free tier covers what most small business websites need. Setting it up means pointing your domain's DNS at them, which takes about fifteen minutes and is the sort of thing worth having someone do properly if you are not confident.
4. Check whether your hosting is the bottleneck
Only worth acting on if the evidence points here, but decisive when it does.
Cheap shared hosting means your website sits on a server with hundreds of others, competing for the same processor and memory. When one of them has a busy day, you get slower. You will not be told when this happens.
The way to tell is Time to First Byte, which is how long the server takes to send back the very first piece of the page. Your PageSpeed report shows it under "Reduce initial server response time". If that number is high and your images and scripts are already in decent shape, the server is your problem, and no amount of front-end tuning will fix it.
Upgrading to decent managed hosting or a VPS solves it, and typically costs somewhere between fifteen and fifty pounds a month depending on what you need. We have written a full breakdown of what website hosting actually costs in the UK, including the fees that tend not to appear until renewal.
One caution: hosting is where slow websites get sold expensive upgrades they do not need. If your TTFB is fine, a faster server will not make your 4MB images load any quicker. Check the evidence first.
5. Stop the page jumping about
The fix nobody writes about properly, and the one your visitors notice most.
You have experienced this. You go to tap a link, an image finishes loading above it, the whole page shunts down, and you tap an advert instead. That is Cumulative Layout Shift, and it is a third of Core Web Vitals.
It is not strictly a speed problem, which is why most guides mention the metric and then never tell you how to fix it. It is a stability problem, and it makes a site feel far worse than a slightly slow one does.
Three causes account for nearly all of it:
- Images without dimensions. If the browser does not know how much space an image needs, it reserves none, then shoves everything down when it arrives. Setting width and height attributes fixes this, and every modern site build should do it by default.
- Web fonts swapping in. The page renders in a fallback font, your real font loads, and the text reflows. Using font-display: swap along with preloading your main font reduces the jolt. Using fewer font weights reduces it further.
- Injected content. Cookie banners, notification bars and adverts that appear after the page has rendered and push everything down. Reserve the space for them in the layout rather than letting them insert themselves.
The advice you can now safely ignore
Here is the part most articles on this topic get wrong, and, until this rewrite, so did ours.
You will read, repeatedly, that you should reduce the number of HTTP requests, combine your CSS and JavaScript into single files, and merge your images into sprites. It appears in guides published this year. It appeared in the previous version of this very article.
That advice comes from HTTP/1.1, where browsers could only open a limited number of connections to a website at once, so every extra file genuinely queued behind the others. Mozilla's documentation describes the constraint plainly: browsers worked around head-of-line blocking by allowing up to six connections per website.
HTTP/2 removed that constraint. It is a multiplexed protocol, meaning many requests travel in parallel over one connection. The per-file penalty that all those workarounds existed to avoid is largely gone.
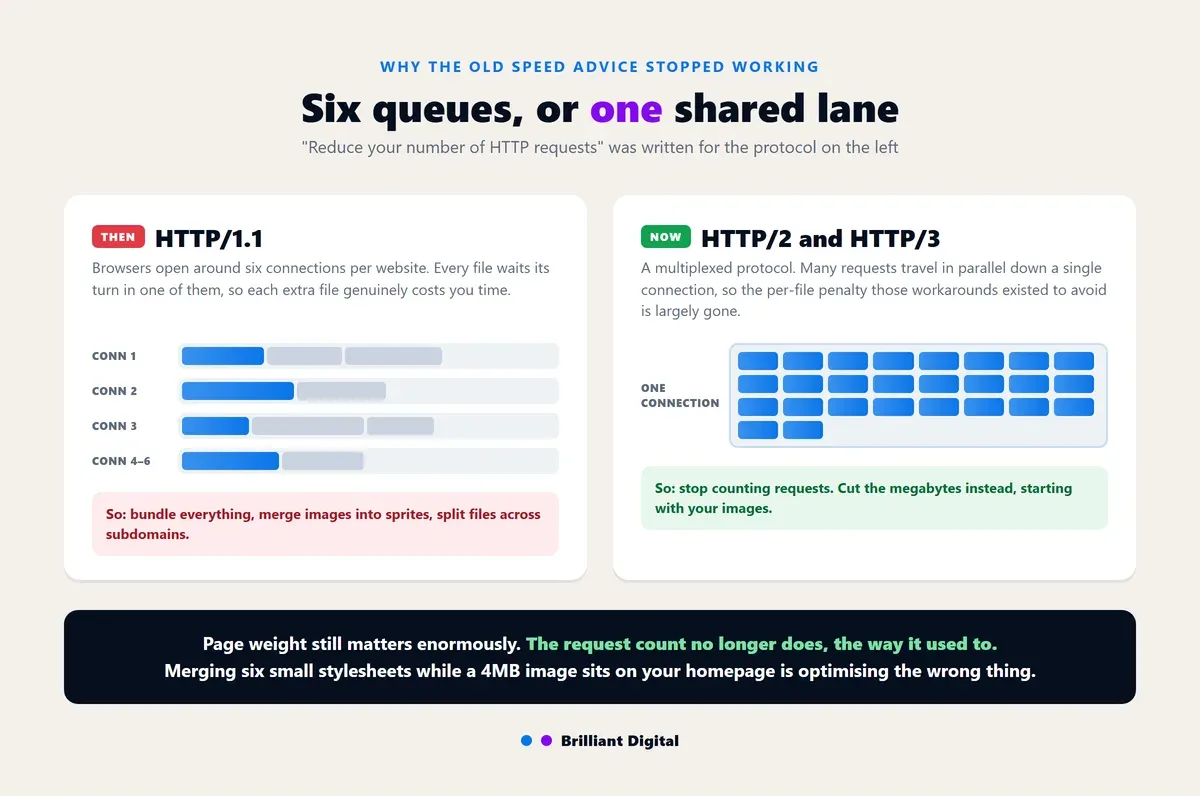
Some of those old tricks are now actively harmful. Mozilla's guidance on domain sharding, the practice of spreading files across multiple subdomains to win more connections, states outright that under HTTP/2 it is detrimental to performance.
Bundling is subtler. It is not harmful, and there are still reasons to do it, but chasing it as a priority is misplaced effort. Aggressive bundling can hurt you: change one line of code and you invalidate the whole cached bundle for every returning visitor.
To be clear about what has not changed. Page weight still matters enormously. Fewer and smaller files are still better. What has changed is the reason. The problem is the megabytes, not the request count, and if you spend your afternoon merging six small stylesheets while a 4MB image sits on your homepage, you have optimised the wrong thing.
It is a good illustration of a wider point about this topic. A great deal of website speed advice online is genuinely old, repeated from article to article without anyone re-checking whether it still holds. When you read a guide, look at whether it mentions HTTP/2, INP, or Core Web Vitals at all. If it does not, it may be describing a version of the web that no longer exists.
Frequently asked questions
What is a good speed for a website?
Aim for your main content to appear within 2.5 seconds, which is Google's threshold for a good Largest Contentful Paint score. Under two seconds is comfortable. Over four seconds is where you start losing a meaningful number of visitors before the page has finished loading.
What are the common causes of slow page speed?
In our experience the order is consistent: oversized images first, third-party scripts second, then missing caching, then underpowered shared hosting. Bloated themes and an excess of plugins sit behind those, and are usually a symptom of one of the first four rather than a separate cause.
How do I make my website run faster without a developer?
Three things, all of which you can do yourself. Resize and compress your images before uploading them. Delete any tracking scripts, widgets or plugins you are not actively using. Install a caching plugin if you are on WordPress. Those three cover a large share of what is achievable without touching code.
Does page speed affect SEO?
It contributes, but it is not decisive. Google uses page experience signals including Core Web Vitals as part of ranking, and they matter most as a tiebreaker between pages of otherwise similar quality. A fast page with thin content will not outrank a slow page that answers the question properly.
How long does it take to fix a slow website?
Images and unused scripts can usually be sorted in an afternoon and often produce the largest improvement. Caching and a CDN take an hour or two to configure. Migrating hosting takes a day and some care. If a site needs rebuilding because the underlying theme is the problem, that is a project rather than a fix.
Where to start
If you take one thing from this: run PageSpeed Insights on your homepage, then work down the opportunities list it gives you in order. It has already done the diagnosis. Most sites need two or three of the five fixes above, not all five, and the report tells you which.
If you get through that and the numbers still look wrong, the problem is usually structural, and that is a different conversation. A site built on a heavy page-builder theme with thirty plugins can sometimes be tuned, and sometimes needs rebuilding. Speed is one of the things worth getting right at the design stage rather than retrofitting, and it is worth keeping an eye on afterwards too, because sites tend to get slower over time as content and tools accumulate.
We build fast websites for UK businesses, and we are happy to look at an existing one and tell you honestly whether it needs tuning or replacing. No obligation and no hard sell, just a straight answer about what is actually slowing it down. Get in touch and tell us the address.